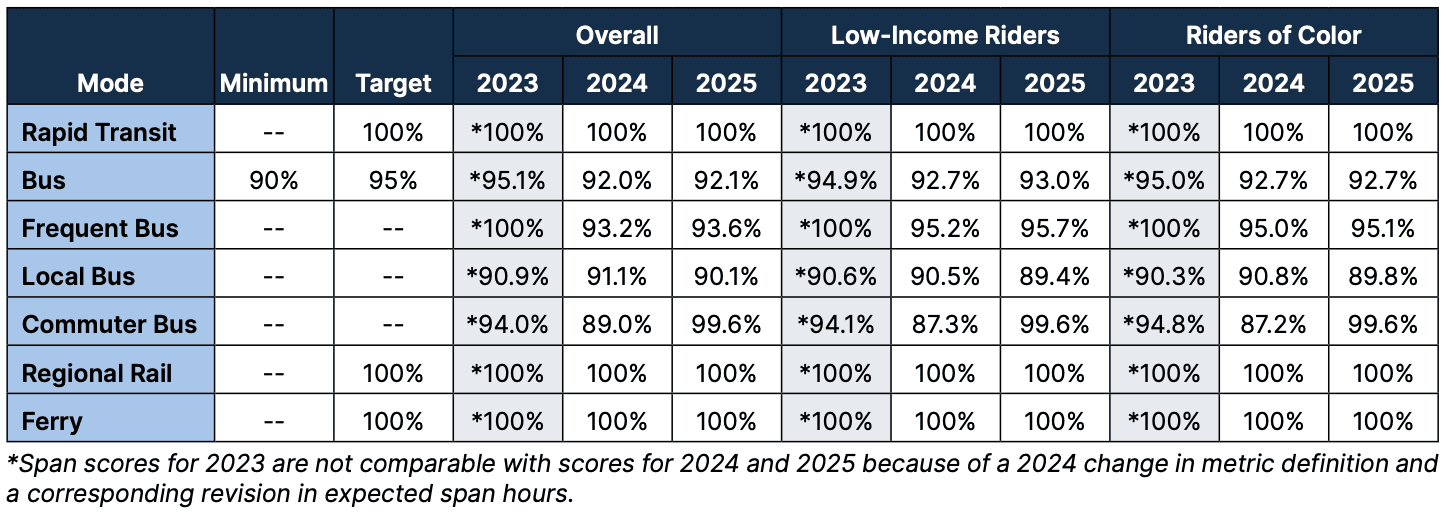
During my co-op with the MBTA’s Office of Performance Management and Innovation (OPMI), I worked on the layout, typesetting, and publishing for two major public documents: the 2025 Rider Census Report and the 2025 Service Delivery Policy (SDP) Annual Report. Dealing with dozens of performance metrics across bus, subway, rail, and ferry lines required balancing MBTA and OPMI brand standards, accessibility, and dense data visualization.
What I Did
Typeset and formatted both full-length public reports in Adobe InDesign. Overhauled the InDesign templates with custom paragraph, character, and object styles to automate text and element spacing, eliminating the need for manual layout nudging and formatting.
Taught myself R and
ggplot2to streamline the SDP report's workflow. Previously, existing scripts only outputted bare-bones chart structures and unformatted data, requiring manual styling in Illustrator and InDesign. I updated the scripts to output fully styled, production-ready sparklines and formatted tables directly on the initial run—completely removing manual post-processing.Processed statewide GTFS data in ArcGIS Pro to design custom transit route overlays and reference maps for the Rider Census report.
Built layouts to meet WCAG and ADA digital accessibility standards, ensuring reports were fully readable for all public stakeholders.
Gallery